Definition
A spectrogram is another way that the physical properties of speech can be visualized. Spectrograms are also used to measure amplitude (loudness), however, more information can be extracted upon observing spectrograms. In contrast to waveforms, amplitude is represented via a darkness in energy across the y-axis of the spectrogram.
- Vocal fold vibrations and formants can also be observed on the spectrogram. Vocal fold vibrations are represented via the faint “squiggly” vertical lines in the energy bands of the spectrogram.
- Formants are a visual representation of the frequencies of sound wave vibration within the vocal tract. Differences in frequencies (and thus formants) are a result of the lips and tongue being positioned differently during articulation. Formants are particularly useful in identifying different vowels, as vowels differ in terms of lip rounding and tongue placement; if the tongue is in different areas of the mouth, the sound waves will vibrate differently.
- Formants are usually labelled by F1, F2, F3, etc,. Each vowel has a different formant configuration. Sizes in vocal tract also results in slight differences across speakers.
Examples
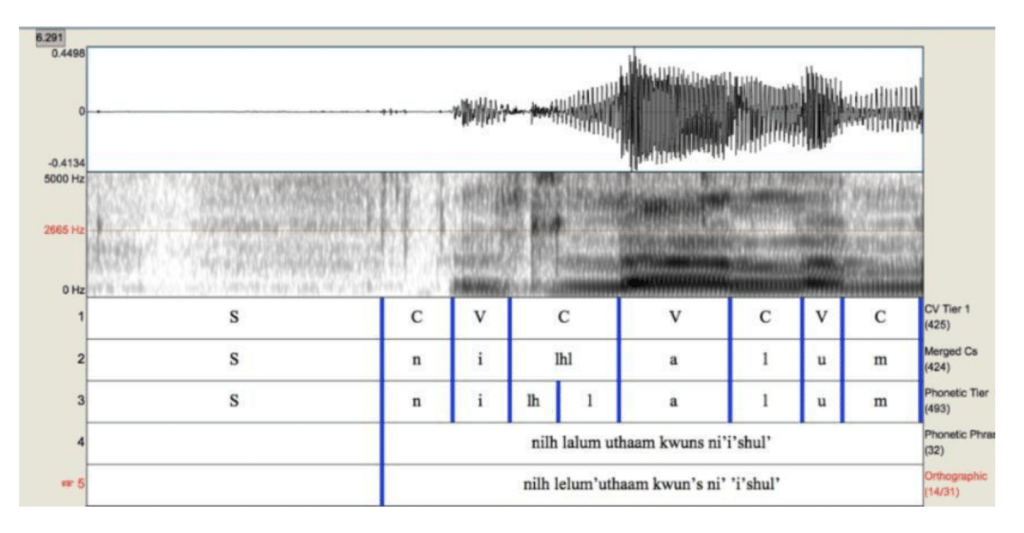
- Hul’q’umi’num’: this example provided by Marshall and Bird (2018, p. 116) illustrates both a waveform (top) and spectrogram (middle), along with its corresponding phonemes (bottom 4 rows).
- Looking at the spectrogram specifically, it can be seen that similar to the waveform, the loudness of vowels is represented via darker bands of energy along the y-axis of the spectrogram. The quieter (lower amplitude) segments can be observed to having fewer darker bands in the spectrogram, as represented by the nasal, n.
- It can be observed that the vowel a has different formants (resonating frequencies) than the vowels i and u, represented by different bands of darkness in the spectrogram.